
Economic Indicators for Portugal
|
GDP (purchasing power parity): $252.2 billion (2011 est.)
country comparison to the world: 51 $255.9 billion (2010 est.) $252.4 billion (2009 est.) note:data are in 2011 US dollars 1 European Union $ 15,650,000,000,000 2011 est. 2 United States $ 15,290,000,000,000 2011 est. 50 United Arab Emirates $ 262,100,000,000 2011 est. 51 Portugal $ 252,200,000,000 2011 est. 52 Israel $ 238,200,000,000 2011 est. GDP (official exchange rate): $238.9 billion (2011 est.) GDP - real growth rate: -1.5% (2011 est.) country comparison to the world: 207 1.4% (2010 est.) -2.9% (2009 est.) 1 Qatar 18.80 2011 est. 162 United States 1.70 2011 est. 167 European Union 1.60 2011 est. 207 Portugal -1.50 2011 est. 214 Greece -6.90 2011 est. 215 Anguilla -8.50 2009 est. 216 Yemen -10.50 2011 est. GDP - per capita (PPP):
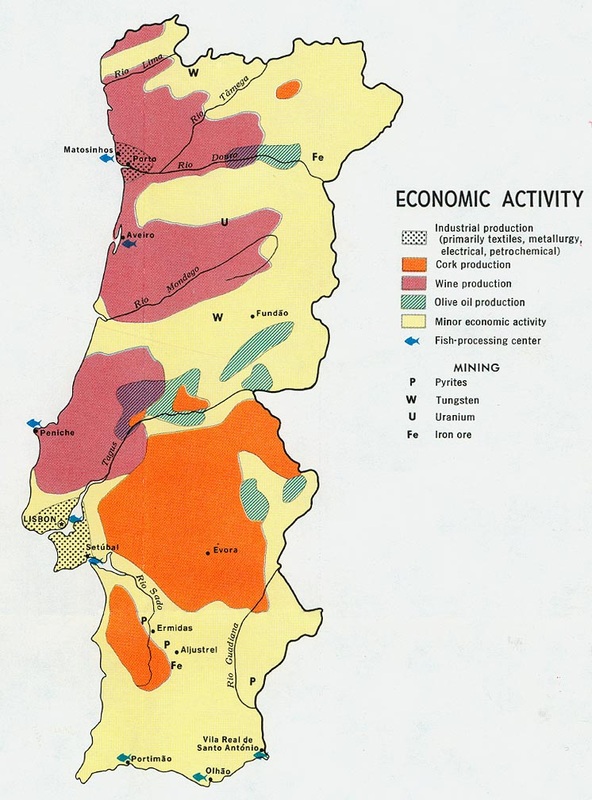
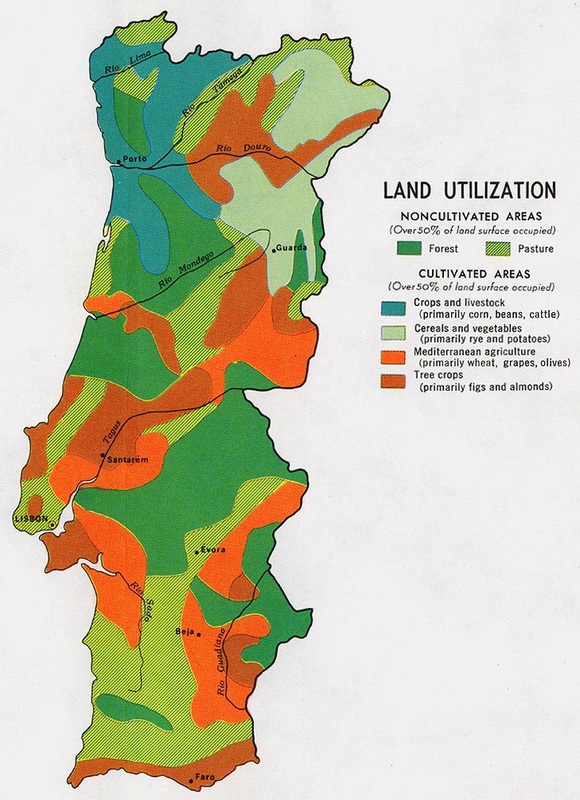
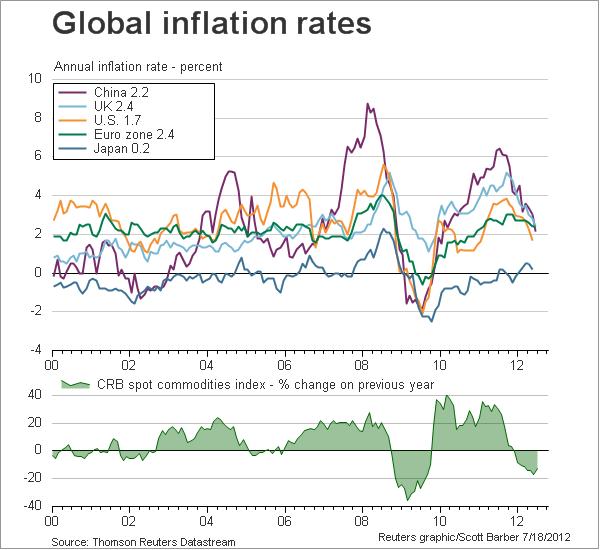
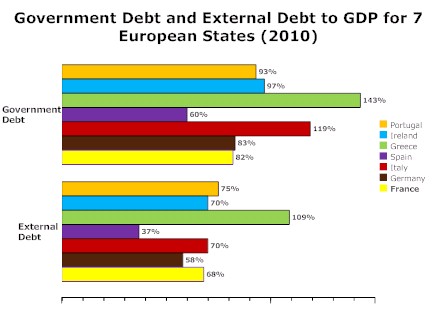
$23,700 (2011 est.) country comparison to the world: 56 $24,100 (2010 est.) $23,800 (2009 est.) note:data are in 2011 US dollars 11 United States $ 49,000 2011 est. 38 European Union $ 34,500 2011 est. 52 Greece $ 26,600 2011 est. 55 Saudi Arabia $ 24,500 2011 est. 56 Portugal $ 23,700 2011 est. 57 Barbados $ 23,700 2011 est. 60 Poland $ 20,600 2011 est. GDP - composition by sector: agriculture: 2.5% industry: 22.8% services: 74.7% (2011 est.) Labor force: 5.543 million (2011 est.) country comparison to the world: 71 Labor force - by occupation: agriculture: 11.7% industry: 28.5% services: 59.8% (2009 est.) Unemployment rate: 12.7% (2011 est.) country comparison to the world: 133 10.8% (2010 est.) 103 United States 9.00 2011 est. 133 Portugal 12.70 2011 est. 157 Greece 17.30 2011 est. Population below poverty line: 18% (2006) Household income or consumption by percentage share: lowest 10%: 3.1% highest 10%: 28.4% (1995 est.) Distribution of family income - Gini index: 38.5 (2007) country comparison to the world: 71 35.6 (1995) 15 Chile 52.1 2009 42 United States 45.0 2007 71 Portugal 38.5 2007 99 Greece 33.0 2005 114 European Union 30.4 2010 est. Investment (gross fixed): 18% of GDP (2011 est.) country comparison to the world: 118 Budget: revenues: $110.8 billion expenditures: $120.2 billion (2011 est.) Taxes and other revenues: 46.4% of GDP (2011 est.) country comparison to the world: 29 Budget surplus (+) or deficit (-): -4% of GDP (2011 est.) country comparison to the world: 132 Public debt: 112.8% of GDP (2011 est.) country comparison to the world: 11 93.3% of GDP (2010 est.) 1 Zimbabwe 220.10 2011 est. 2 Japan 211.70 2011 est. 4 Greece 161.70 2011 est. 11 Portugal 112.80 2011 est. 12 Ireland 105.40 2011 est. 16 Canada 87.40 2011 est. 23 Germany 81.80 2011 est. 35 United States 67.70 2011 est. 132 Chile 9.20 2011 est. Inflation rate (consumer prices): 3.7% (2011 est.) country comparison to the world: 87 1.4% (2010 est.) Central bank discount rate: 1.75% (31 December 2011) country comparison to the world: 116 1.75% (31 December 2010) note:this is the European Central Bank's rate on the marginal lending facility, which offers overnight credit to banks in the euro area Commercial bank prime lending rate: 5.7% (31 December 2011 est.) country comparison to the world: 165 4.225% (31 December 2010 est.) Stock of domestic credit: $556.3 billion (31 December 2009 est.) country comparison to the world: 26 $490.8 billion (31 December 2008 est.) Market value of publicly traded shares: $61.69 billion (31 December 2011) country comparison to the world: 46 $82 billion (31 December 2010) $98.65 billion (31 December 2009) Agriculture - products: grain, potatoes, tomatoes, olives, grapes; sheep, cattle, goats, pigs, poultry, dairy products; fish Industries: textiles, clothing, footwear, wood and cork, paper, chemicals, auto-parts manufacturing, base metals, porcelain and ceramics, glassware, technology, telecommunications; dairy products, wine and other foods; ship construction and refurbishment; tourism Industrial production growth rate: -2% (2011 est.) country comparison to the world: 154 Current account balance: -$15.1 billion (2011 est.) country comparison to the world: 179 -$22.85 billion (2010 est.) 1 China $ 201,700,000,000 2011 est. 178 South Africa $ -13,340,000,000 2011 est. 179 Portugal $ -15,100,000,000 2011 est. 180 Poland $ -22,130,000,000 2011 est. 181 Greece $ -29,320,000,000 2011 est. 182 European Union $ -32,720,000,000 2011 est. 192 United States $ -473,400,000,000 2011 est. Exports: $55.8 billion (2011 est.) country comparison to the world: 57 $48.91 billion (2010 est.) Exports – commodities: agricultural products, food products, wine, oil products, chemical products, plastics and rubber, hides, leather, wood and cork, wood pulp and paper, textile materials, clothing, footwear, machinery and tools, base metals Exports - partners: Spain 25.1%, Germany 13.7%, France 12.1%, Angola 5.5%, UK 5.1% (2011) Imports: $77.25 billion (2011 est.) country comparison to the world: 40 $73.02 billion (2010 est.) Imports - commodities: agricultural products, chemical products, vehicles and other transport material, and optical and precision instruments, computer accessories and parts, semi-conductors and related devices, oil products, base metals, food products, textile materials Imports - partners: Spain 31.7%, Germany 12.4%, France 6.9%, Italy 5.4%, Netherlands 4.8% (2011) Reserves of foreign exchange and gold: $21.34 billion (31 December 2011 est.) country comparison to the world: 56 $21 billion (31 December 2010 est.) Debt - external: $548.3 billion (30 June 2011) country comparison to the world: 24 $497.8 billion (30 June 2010) 1 European Union $ 16,080,000,000,000 30 June 2011 2 United States $ 14,710,000,000,000 30 June 2011 22 Greece $ 583,300,000,000 30 June 2011 23 Finland $ 577,000,000,000 31 December 2011 24 Portugal $ 548,300,000,000 30 June 2011 25 Russia $ 519,400,000,000 30 September 2011 est. Stock of direct foreign investment - at home: $109.8 billion (31 December 2011 est.) country comparison to the world: 33 $110.2 billion (31 December 2010 est.) Stock of direct foreign investment - abroad: $64.25 billion (31 December 2011 est.) country comparison to the world: 31 $64.25 billion (31 December 2010 est.) |
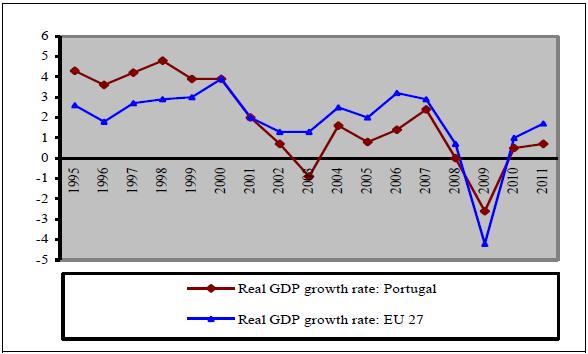
GDP for the 27 EU countries
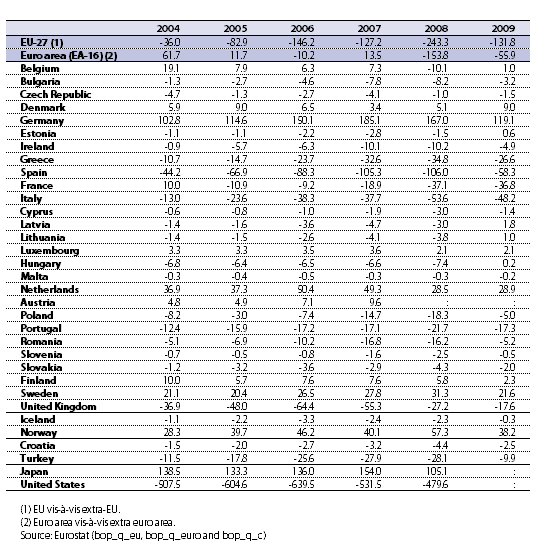
Current account balance - EU compared to select countries
|
